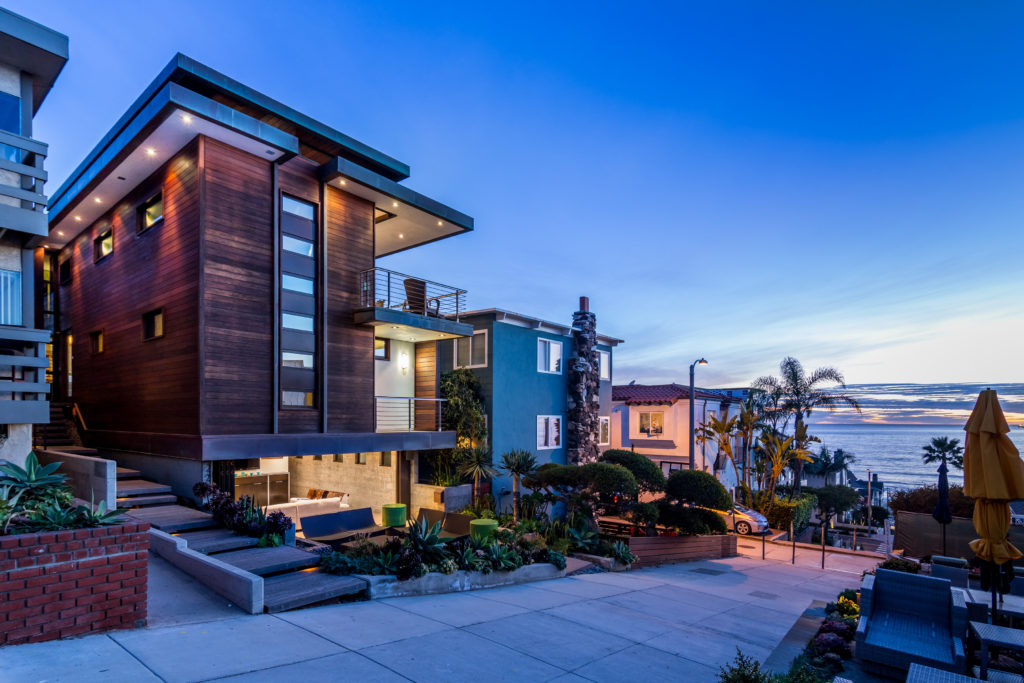
The Sand Section of Manhattan Beach is often the area most people see when they visit. Big ocean views….walk to the beach….near constant  beach breezes….it’s the epitome of luxury coastal living. Demand for homes in the sand section remained high in 2018 with 133 home sales during the year.
View the current homes for sale in the Sand Section of Manhattan Beach
Median list prices for homes during the year were $2,980,000 with the median sales price at $2,925,000. Average list price was just over $3,746,000 with the average sales price at $3,596,000. As is always the case with the sand section the numbers were skewed a bit due to some oceanfront Strand homes priced well into 8 digits with the highest sale at a stunning $17,400,000 while 108 The Strand closed out the year at $15,250,000.
2018 Manhattan Beach Real Estate….The Numbers
| Date | January | Feb | March | April | May | June | July | August | Sept | Oct | Nov | Dec |
| For Sale |
29 | 42 | 46 | 50 | 51 | 51 | 49 | 49 | 49 | 49 | 36 | 27 |
| New Listing |
17 | 29 | 22 | 18 | 21 | 26 | 25 | 14 | 18 | 18 | 7 | 6 |
| Sold | 7 | 5 | 13 | 11 | 11 | 16 | 16 | 15 | 10 | 12 | 9 | 9 |
| Pended | 9 | 11 | 17 | 6 | 14 | 19 | 15 | 13 | 9 | 8 | 11 | 8 |
| Months of Inventory (Closed Sales) |
4.1 | 8.4 | 3.5 | 4.5 | 4.6 | 3.2 | 3.1 | 3.3 | 4.9 | 4.1 | 4 | 3 |
| Months of Inventory (Pended Sales) |
3.2 | 3.8 | 2.7 | 8.3 | 3.6 | 2.7 | 3.3 | 3.8 | 5.4 | 6.1 | 3.3 | 3.4 |
| Absorption Rate (Closed Sales) % |
24.1 | 11.9 | 28.3 | 22 | 21.6 | 31.4 | 32.7 | 30.6 | 20.4 | 24.5 | 25 | 33.3 |
| Absorption Rate (Pended Sales) % |
31 | 26.2 | 37 | 12 | 27.5 | 37.3 | 30.6 | 26.5 | 18.4 | 16.3 | 30.6 | 29.6 |
| Avg. Active Price |
$7,293,000 | $6,391,000 | $5,565,000 | $5,902,000 | $5,552,000 | $5,495,000 | $5,751,000 | $6,124,000 | $5,894,000 | $5,614,000 | $6,154,000 | $5,485,000 |
| Avg. Sold Price |
$3,153,000 | $3,640,000 | $3,717,000 | $2,642,000 | $3,472,000 | $3,428,000 | $3,656,000 | $4,333,000 | $4,143,000 | $3,963,000 | $3,011,000 | $4,022,000 |
| Avg. Sq. Ft. Price (Sold) | $1,518 | $1,533 | $1,431 | $1,273 | $1,243 | $1,431 | $1,330 | $1,543 | $1,619 | $1,543 | $1,515 | $1,400 |
| Sold/List Diff. % |
97 | 96 | 98 | 99 | 100 | 98 | 96 | 96 | 99 | 96 | 97 | 97 |
| Sold/Orig LP Diff. % |
94 | 90 | 96 | 99 | 97 | 98 | 92 | 93 | 96 | 94 | 94 | 91 |
| Avg Days on Market |
90 | 102 | 37 | 38 | 47 | 22 | 75 | 77 | 24 | 68 | 50 | 90 |
| Median Sold Price | $2,840,000 | $3,264,000 | $3,500,000 | $2,500,000 | $3,725,000 | $2,604,000 | $2,840,000 | $3,250,000 | $2,725,000 | $3,450,000 | $2,700,000 | $2,475,000 |
The Sand Section generally had bewtween 35 and 50 active homes for sale during most of the year with the usual drop off around the holidays and winter months.

